A Tesla Battery Pack Failure During a Drive: What Dr.EV Recorded
BatterMachine, September 2026.
This case are published with the user’s authorization. Personal identifying information has been excluded.
A Dr.EV user in China experienced a high-voltage battery fault during a drive on September 1, 2026. The vehicle still displayed 32 km of remaining range, but the center screen warned the driver to pull over safely because the vehicle was shutting down.
The Dr.EV driving chart recorded a sudden change in cell-group voltage difference. Later inspection photos also showed substantial dents in the high-voltage battery enclosure at the rear lifting points.
These records show what happened before and after the warning. They do not prove which component inside the pack caused the electrical abnormality.
The warning seen by the driver
The recorded trip ran from 20:36 to 21:40. Near the end of the drive, the vehicle showed 32 km of range together with the shutdown warning.
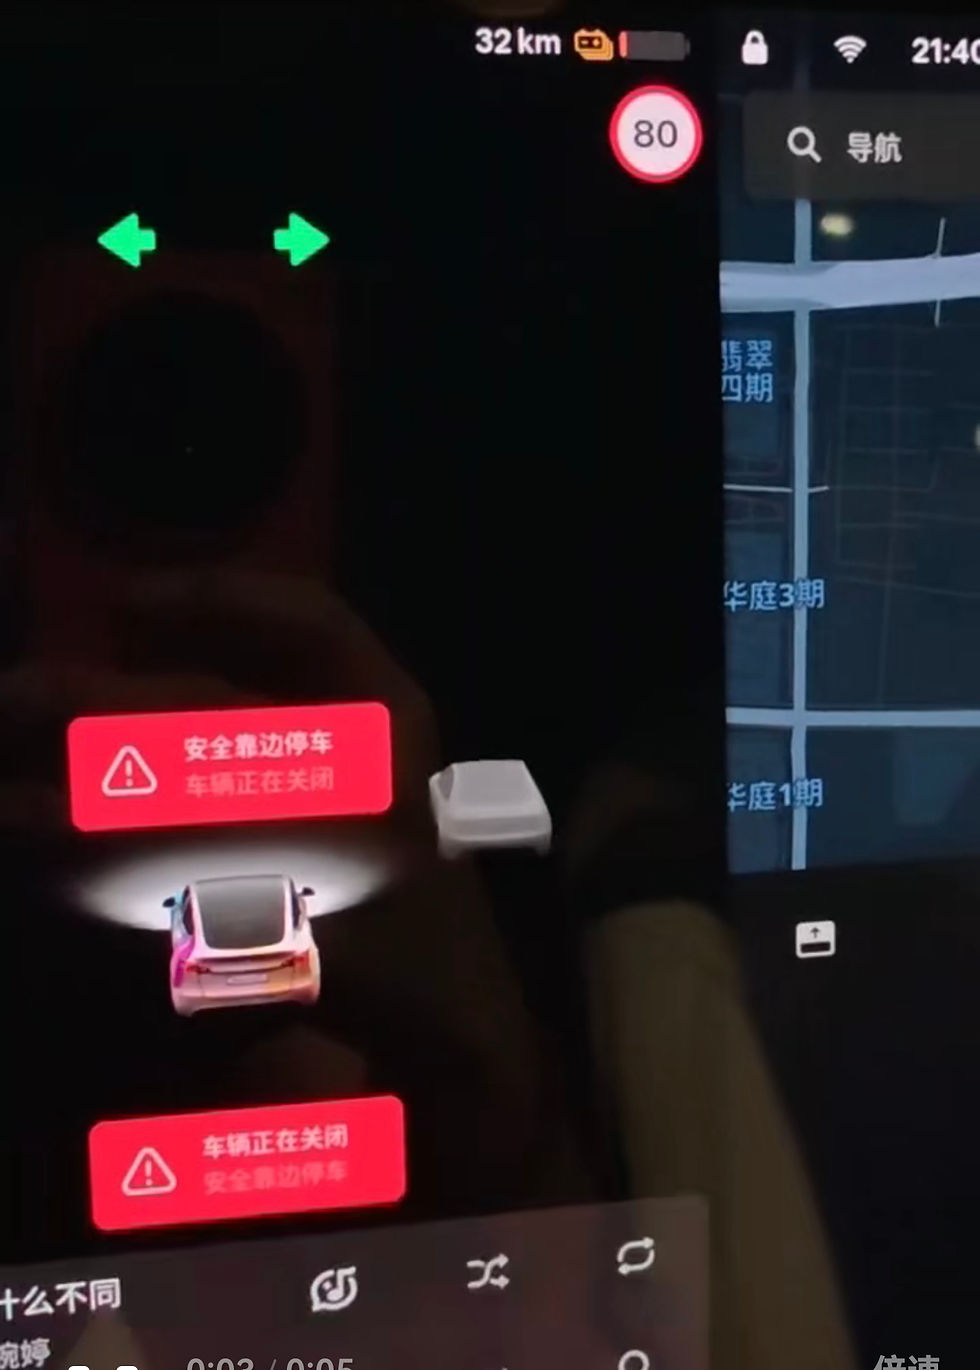
Figure 1. The driver-facing warning. The complete alert code is not visible in the photograph.
Remaining range is a vehicle-level estimate. Battery protection also depends on the voltage reported by every series-connected cell group. A vehicle can therefore display remaining range while stopping operation because one reported group has reached a limiting condition.
The sudden change in the Dr.EV chart
The upper Dr.EV chart shows cell voltage in orange and C-rate in blue. The lower chart shows maximum cell-group voltage difference in orange and battery level in blue.

Figure 2. Dr.EV record from 20:36 to 21:40.
The important observation comes from comparing C-rate with voltage difference.
Part of the drive | C-rate shown in the upper chart | Maximum voltage difference |
Above approximately 40% battery | Many strong negative C-rate events, some approaching the lower end of the chart near −7C | Mostly below approximately 0.1 V |
Below approximately 40% battery | The load is not consistently greater than it was earlier | The difference suddenly becomes large and unstable, with transient peaks approaching 1.0 V |
Near 7.3% battery | Negative C-rate is still present | Approximately 0.548–0.568 V |
This means high C-rate alone does not explain the large voltage difference. Earlier in the drive, the chart shows equal or stronger negative C-rate events without a large separation among the reported cell-group voltages.
At around 40% displayed battery level, the behavior changes. After that point, driving load appears to expose or amplify an abnormal condition. The maximum difference later approaches 1.0 V. The 0.548–0.568 V values shown below are the readings near the end of the trip, not the maximum value reached during the complete drive.

Figure 3. Near 21:39, the displayed battery level was approximately 7.6%–7.7%. Near 21:40, it was approximately 7.3%, with a reported cell-group range of 2.526–3.074 V and a difference of 0.548 V.
Physical deformation of the battery pack
Photos taken after removal of the high-voltage battery show large inward dents in the pack enclosure. The service record identifies the locations as both rear support or lifting points and lists the damage type as denting.

Figure 4. Two visibly deformed areas on the pack enclosure.

Figure 5. Deformation at another rear support area.
These are physical deformations, not only surface scratches. The photographs do not show how the dents occurred, so they should not be presented as proof of improper lifting or a particular accident.
The deformation could possibly have affected a component near the damaged area, including:
A voltage-sensing wire or connector
A busbar, weld, fuse, or other electrical connection
A cell group or module
A cooling component or module support structure
The photographs do not show the inside of the affected locations. They therefore cannot establish whether any of these components was actually damaged.
What the service record says
The service record describes the customer’s complaint as a high-voltage battery fault. It also records dents at both rear lifting points.

Figure 6. Publication crop of the service record. The service-order number and unrelated billing information are excluded.
The visible inspection results include:
High-voltage battery exterior: recorded as normal
Recorded damage location: both rear support or lifting points
Recorded damage type: dents
High-voltage battery airtightness test: passed
One-minute pressure difference: 0.002 PSI
Battery SOC during service: 19%
Insulation resistance: 10,072 kΩ
Signs of water exposure on the battery surface: marked “No,” although the following description appears to mention water staining in the center area
Liquid inside the high-voltage battery: no, approximately 0 litres
Selected service option: D
Option D calls for replacement with a factory-repaired or refurbished high-voltage battery, with the old battery recovered by Tesla.
Passing the airtightness test and finding no internal liquid indicate that the enclosure was not obviously punctured or leaking. The high insulation-resistance value also does not show a major electrical leak from the high-voltage system to the enclosure.
Those checks do not establish that everything inside the pack was mechanically or electrically undamaged. An enclosure can remain sealed while a sensing connection, internal conductor, module mounting point, or cell group has been affected.
The form also appears to classify the battery exterior as normal while separately recording dents at both rear lifting points. The photographs provide direct evidence of deformation, but the reason for this wording in the form is not available.
Possible explanations
The combined records allow several possibilities to be discussed without selecting one as the cause.
Physical deformation may have placed pressure on an internal connection, sensing circuit, module, or cell group. This could possibly create an abnormal voltage reading or a real voltage drop under load.
A voltage-sensing connection could also have become unstable independently of the dents. A loose sensing wire, connector, or shared voltage tap can produce a sudden change in the reported voltage difference and cause the BMS to respond protectively.
An internal current-carrying connection could have developed high resistance. In that situation, the reported voltage difference would grow when current increased and might recover when the load was removed.
A weak cell group remains another possibility. A group with reduced capacity or increased resistance may remain close to the others at higher battery levels and separate rapidly when it reaches its lower-voltage region.
What Dr.EV adds to this case
Without the driving chart, the available evidence would show physical pack damage, a vehicle warning, and a replacement decision. Dr.EV adds the behavior leading up to the warning:
Strong C-rate events occurred earlier without a large voltage difference.
The voltage-difference behavior changed suddenly near 40% battery level.
After that point, the difference became sensitive to driving load.
Transient maximum difference approached 1.0 V.
The difference was still approximately 0.55–0.57 V near the shutdown event.
The vehicle still displayed non-zero battery level and 32 km of remaining range.


Comments